
First ever Greenhouse Gases Profiling Over the EMME Region: From the Troposphere to the Stratosphere, at the crossroads of three continents
Cyprus has a strategic position for greenhouse gases (GHGs) measurements. Being situated between the continents of Europe, Africa and Asia; it experiences the long-range transport of different air masses from large GHG hotspots such as the Middle East. Analysing concentrations, trends, and identifying sources of GHGs (to comply with the Paris Agreement), requires for more dense atmospheric observations; with the added value of constraining climate models that are used to simulate present/future GHG concentrations over the region.
In the EMME region, our TCCON (operational since August 2019) is the only observatory that produces standardised and high-precision (long-term) continuous data of the GHGs: On the other hand, these observations integrate GHG measurements in the atmospheric column (from the ground to the top of the atmosphere) without information on their vertical distribution. Such vertical information is crucial to improve climate models, such as CAMS (described below), or to help policy-makers in their climate action policies.
Within the framework of EMME-CARE project (Eastern Mediterranean and Middle East – Climate and Atmosphere Research), researchers and technical specialists of the Climate and Atmosphere Research Center (CARE-C) of the Cyprus Institute performed for the first time in the EMME region, five (5) vertically-resolved GHG measurements (up to several tens of km altitude) by the mean of “AirCores” flights. These flights were achieved in collaboration with colleagues from CEA and the French AirCore (AC) program.
What is AirCore?
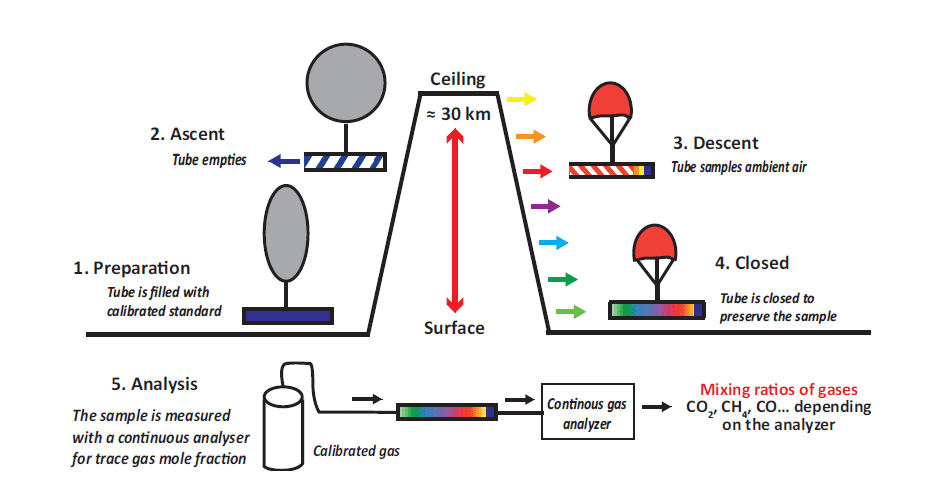
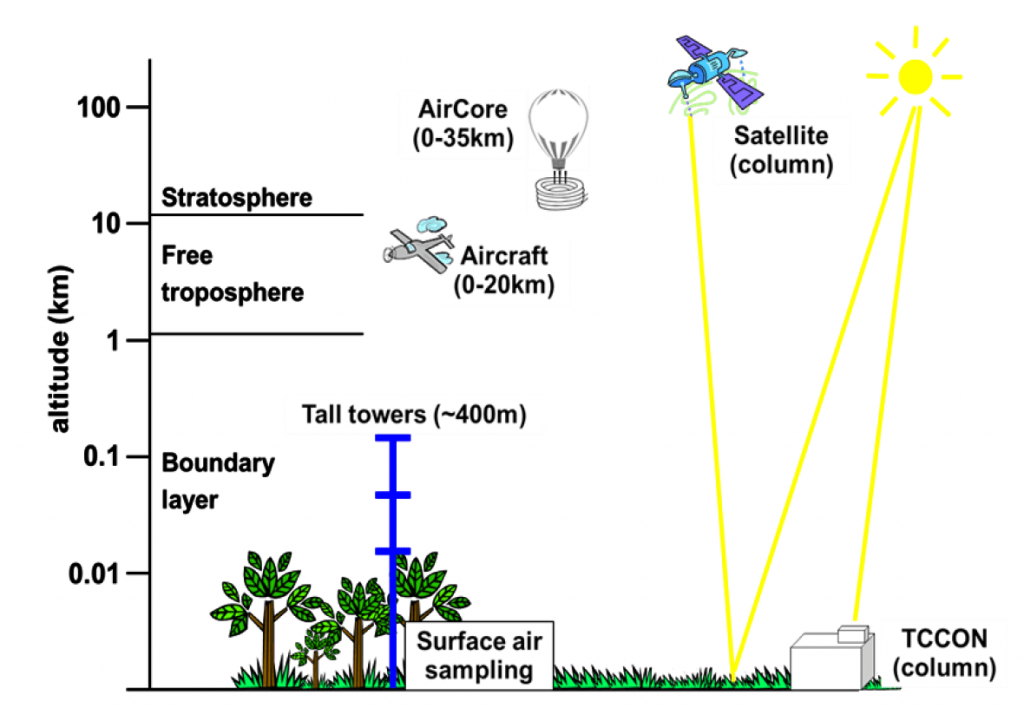
AirCore is a unique system for sampling air and rendering vertical profiles of greenhouse gases (GHGs) concentrations from the surface up to the stratosphere. Carried out by a weather balloon filled with helium, it can reach altitudes typically up to 35 km. On the ascending phase (attached to the balloon) the AirCore tube empties out (via expansion along with decreasing atmospheric pressure). The AirCore is disconnected from the balloon at a prescribed altitude and starts its descend attached to a parachute. Ambient air is sampled on the descending phase via compression. Once the AirCore reaches ground level, it is rapidly geo-localized and brought at the premises of the Cyprus Institute to measure CO2 CH4 and CO concentrations using a Cavity Ring Down Spectrometer (CRDS) from Picarro.
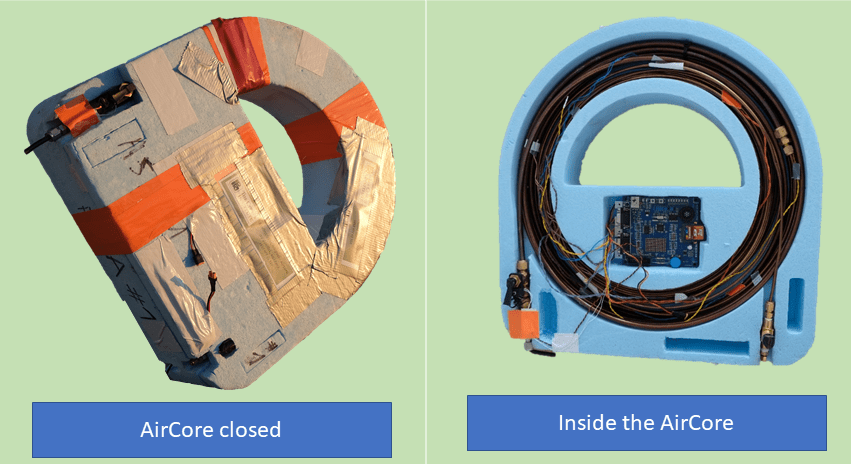
The AirCore used for the Cyprus campaign has a mass of less than 3 Kg and it contains:
- a 35 metres-long coil of stainless-steel tubing made up of 2 tubes, one of 4 mm diameter and the other of 8 mm diameter
- one acquisition unit for measuring pressure, temperature and humidity
- one lithium battery
- one Spot Trace® coupled with a GPS Tracker
AirCore Campaign June 2020
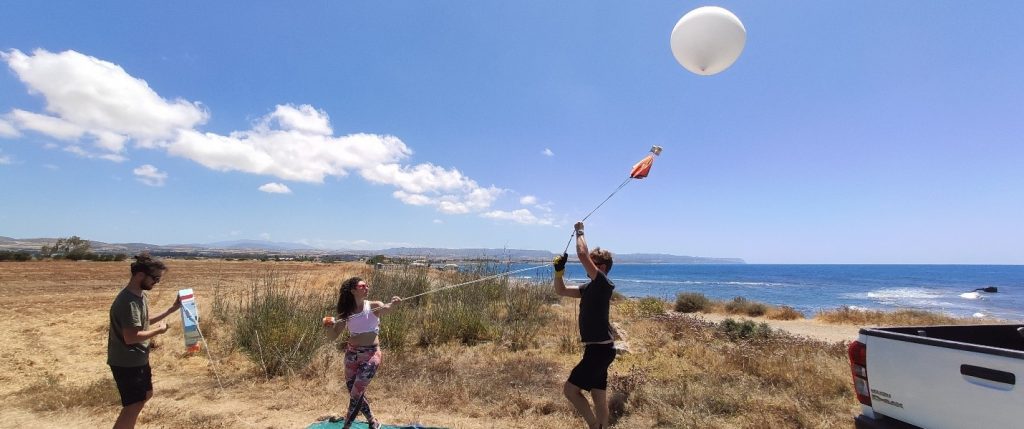
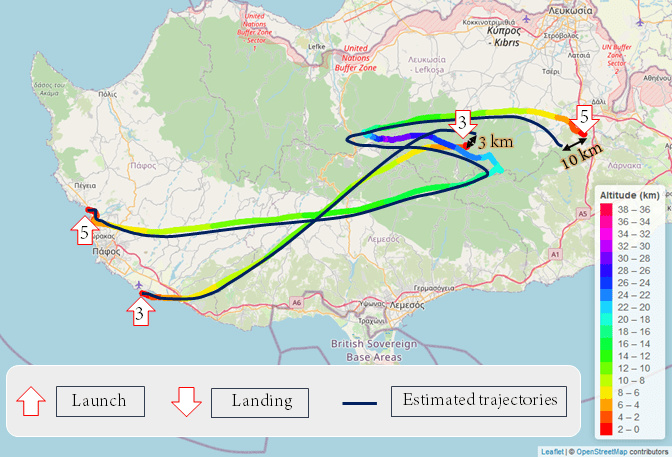
Between the 17th and 30th of June 2020, the balloons were typically launched from the west coast of the island and the AirCore were generally collected at the edge of the Troodos mountains. The duration of a flight was about one hour and a half. When counting road transport, balloon launching preparation, AirCore recovery and GHG analyses, an AirCore profiling typically takes a full day.
An online (forecasting) tool is used for the preparation of the flights plans allowing for predicting the ascending/descending trajectory of the AirCore with a very good accuracy. For example, during the campaign the maximum difference between the estimated and real landing point was usually less than 15 km. Below a comparison between the predicted and the performed flight paths (for the third and fifth day):
A radiosonde system is used to monitor the trajectory of the AirCore during the flight. This is the same system used by the meteorologists. It consists of a transmitter on the AirCore chain with two receiving stations on the ground. Because it is impossible to predict exactly where the AC is going to land, a Spot Trace system coupled with a GPS Tracker are also used for recovery. Also, before and during the flights, communications were established with the Air Traffic Control.
Scientific Achievements of the campaign
The volume of air recovered during an AirCore profiling (around 1 liter) has all the characteristics of a “core” like those obtained by geologists by drilling the ground. The small diameter of the tube limits the diffusion of the air molecules in it and one can assume that the location of these molecules in the tubing corresponds to a typical altitude. The calculation of vertically-resolved greenhouse gas concentrations requires further experience and knowledge in meteorology and fluid mechanics, which we managed to obtain through our collaboration with Le Laboratoire de Météorologie Dynamique (LMD) which supported us to generate the following profiles:

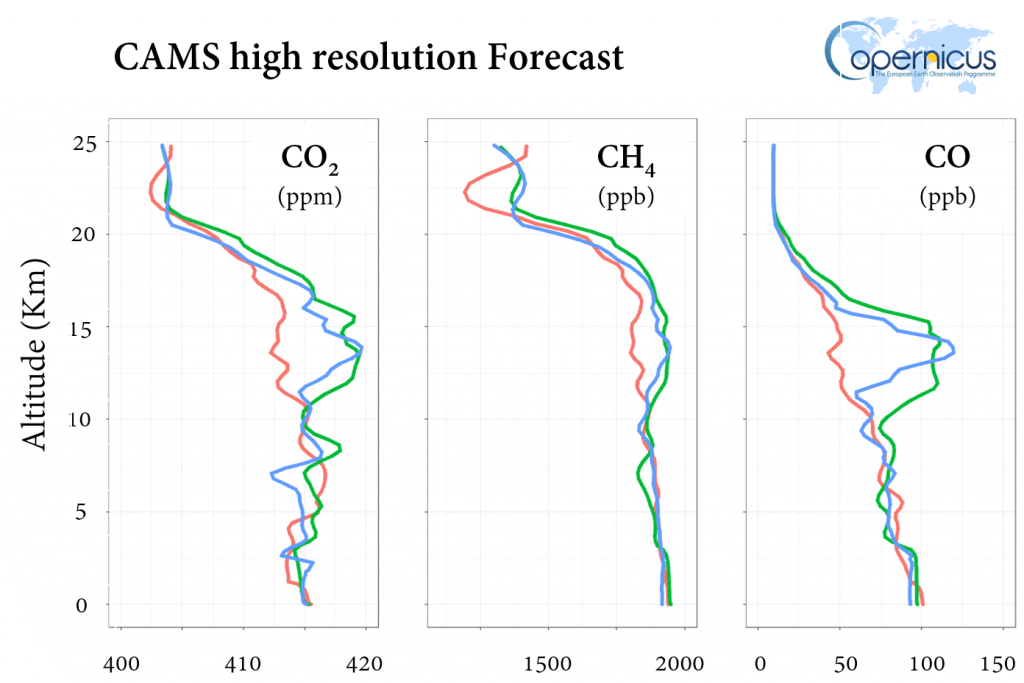
As highlighted in these profiles (red circle) for the lower stratosphere (11 – 17 Km altitude), air masses’ origin switched in the last two flights from western to eastern in an anti-cyclonic pattern. This pattern enabled us to detect the long-range transport of updraft air pollutants associated with the Asian Summer Monsoon as depicted with an increase in CO and CO2 in our profiles (29th and 30th of June).
The AirCore profiles provide an additional constrain for the validation of atmospheric transport models such as the high-resolution forecast of the Copernicus Atmosphere Monitoring Service (CAMS). The CAMS global near-real time (NRT) service produces daily analyses and forecasts of reactive trace gases, greenhouse gases and aerosol concentrations. The comparisons between our AirCore observations and the CAMS model are excellent, as shown below:
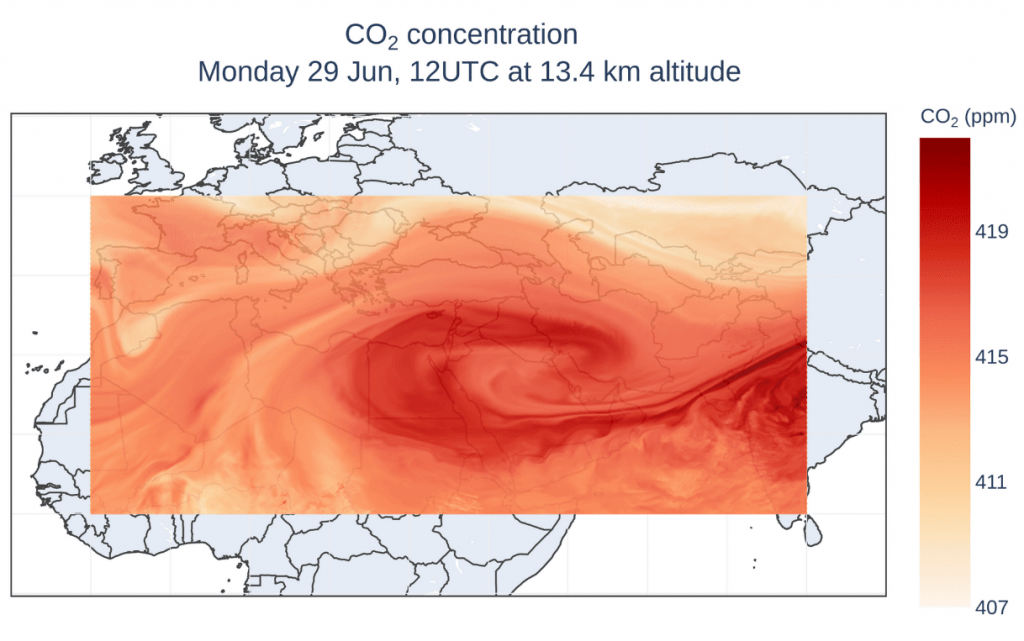
CAMS model outputs can also be used to generate maps of these greenhouse gases concentrations at different altitudes which can be further compared to the continuous survey of CO2 performed at global scale by OCO-2 satellite observations.
Perspectives
AirCore appears as an ideal complement to GHGs observation programs, such as ICOS for surface air in-situ monitoring, or TCCON observations for the validation and comparison with satellite measurements. Our first AirCore measurement campaign confirms the feasibility and strong scientific potential of carrying out regular vertical profiling of GHGs over the EMME region. Overall this activity will contribute to the general Objectives of CARE-C aiming at establishing the first regional continuous (/high quality) observations of GHGs .
Acknowledgments
The Department of Civil Aviation, andthe Air Traffic Control of Paphos Airport and Nicosia for their coordination. Thomas Laemmeland Michel Ramonet from LSCE for their technical support and scientific expertise. All research staff from The Cyprus Institute who participated in the field campaigns, namely from the Unmanned Systems Research Laboratory (USRL) and from the Cyprus Atmospheric Observatory (CAO) team.
Major participants
P.Y. Quéhé1, C. Keleshis1, P. Antoniou1, M. Desservettaz1, C. Constantinides1, C. Rousogenous1, T. Laemmel 2, M. Ramonet2, E. Blandin2, C. Crevoisier3, J. Pernin3, J. Sciare1
1 Climate and Atmosphere Research Center (CARE-C), The Cyprus Institute, Nicosia, Cyprus
2 LSCE/IPSL, CEA-CNRS-UVSQ, Université Paris Saclay, 91191 Gif sur Yvette, France
3 LMD/ IPSL, CNRS, Ecole polytechnique, Université Paris Saclay, 91128, Palaiseau, France