
A space-view of air pollution in Cyprus
By Mihalis Vrekoussis1,2, Andreas Richter1, Jean Sciare2
Why do we need to monitor NO2
Nitrogen oxides (NOx) are chemical species that enter the atmosphere mostly as a result of anthropogenic activities. Fossil fuel combustion from the traffic sector and powerplants, biomass burning, and agriculture comprise some of these activities. Globally, anthropogenic emissions dominate compared to natural ones, e.g., from lightning and wildfires.
A key member of the NOx compounds and one of the most prominent atmospheric pollutants is the nitrogen dioxide (NO2) molecule, a brownish gas associated with air quality issues, including haze, smog, and acid rain phenomena. At high levels, NO2 poses a risk to human health, causing, amongst others, lung irritation and respiratory inflammation.
Due to its importance, scientists have put significant effort into monitoring its amounts by developing in situ and remote-sensing instrumentation. Because of its short lifetime, usually in the order of several hours up to a few days, transport phenomena controlled by ambient meteorological conditions are limited. This allows the detection of NO2 close to its sources from space using satellite instruments.
Space-based observations of NO2
One of the most technologically advanced space-based instruments targeting air pollution from space is the TROPOspheric Monitoring Instrument (TROPOMI) onboard the European Copernicus Sentinel 5 Precursor (S5P) satellite. S5P, launched in 2017, is a near-polar sun-synchronous satellite, orbiting Earth at 817km height, and providing daily overpasses at around 13:30LT. TROPOMI, with its spatial nadir resolution of 7×3.5km, allows for the detection of NO2 at a city level. TROPOMI monitors the absorption of electromagnetic radiation by NO2 molecules when sun radiation penetrates the Earth’s atmosphere. The results presented below show vertical columns densities (VC) of NO2. The latter depicts the number of molecules of NO2 found per square centimeter of air (molecules cm-2) in the lower atmosphere, the troposphere. The plotted map shows the average VC amounts over Cyprus for the summer period in 2019, based on the operational NO2 data provided by the European Copernicus program.
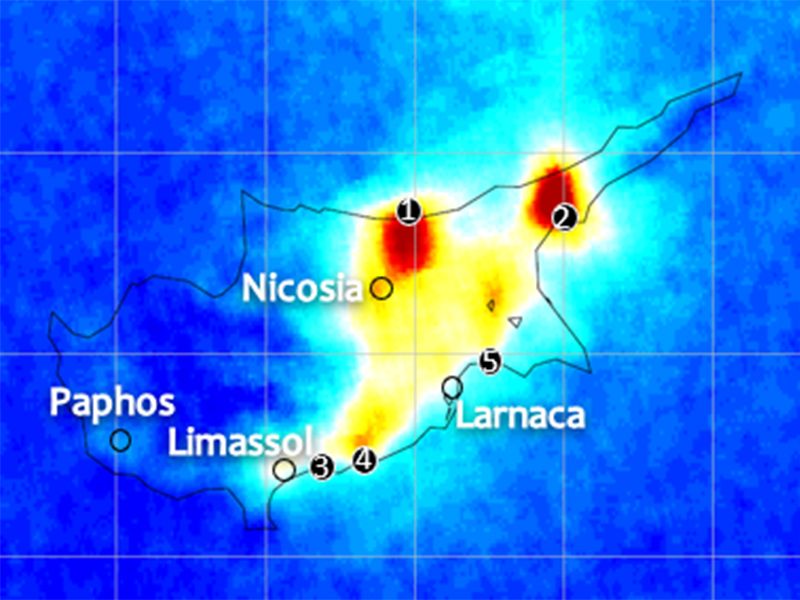
The analysis revealed the following interesting points (Fig 1):
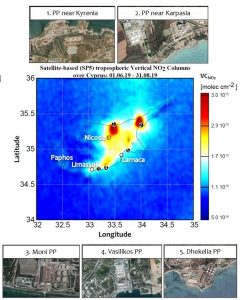
a) Powerplants (PP) are the dominant sources of NO2 on the island for the studied period. The power plant near Kyrenia (362MW, heavy oil & natural gas) and the power plant near Karpasia (175MW, heavy oil) are the strongest emitters of NO2, followed by the Vasiliko (868MW, heavy fuel & natural gas), Dhekelia (460MW, heavy fuel) and Moni (150MW, heavy fuel) ones. Interestingly, the observed pollution strength of the PPs, in terms of NO2 amounts, is not proportional to their operating capacity pointing to less efficient pollution control technologies applied for the cases of the first two power plants.
b) All major cities on the island, namely Nicosia (capital), Limassol, Larnaca, and Paphos, are visible from space, with the NO2 VC amounts being 2-4 times higher than the background levels (~5.1014 molec . cm-2).
c) There is a clear geographic gradient of the NO2 distribution in Cyprus. The eastern part of the island, where most of the anthropogenic activities take place, is substantially more polluted than the western part. Additionally, most of the enhancements emanate from coastal regions.
References
- Institute of Environmental Physics, University of Bremen, Germany
- Climate and Atmosphere Research Center (CARE-C), The Cyprus Institute, Cyprus